PJM Ramps Up Preparations as COVID-19 Hotspots Emerge in Its Footprint
PJM Interconnection, the nation’s largest regional transmission organization (RTO), is intensifying its response to the COVID-19 pandemic, preparing campuses for worker sequestration and closely coordinating with generators and transmission owners across its system as they grapple with workforce and supply impacts.
Although most of PJM’s employees—with the exception of system operators and other essential personnel—are working from home and will continue to do so until May 4, the grid operator said in an April 6 update it is equipping its campuses for sequestration if needed and readying logistics as they pertain to extended stay. It is also readying its control room simulator to serve as a third control room if needed, determining what would be the best use of that facility.
PJM said that the pandemic has not yet had a “major impact” on generator maintenance. However, some generators have reported contractor crew shortages due to travel restrictions, and parts shortages owing to COVID-19 supply chain issues. Several generators have also deferred or reduced the scope of longer, planned outages, and/or shifted work to shorter periods during off-peak hours.
Transmission owners, meanwhile, have not reported significant impacts to maintenance schedules, but the entity is urging transmission owners to inform PJM as soon as possible if COVID-19–related delays will require advanced rescheduling of affected outages.
Like other major RTOs/ISOs, PJM has also reported a drop in power demand—of between 5% and 7% lower than historical trends—but the entity is still exploring how much of that decline can be attributed to the COVID-19 fallout. It noted: “PJM expects that to increase and continues to analyze numbers to isolate weather impact [versus] COVID-19 impact on load,” it said.

Figures PJM posted on April 6 using artificial intelligence (AI) to compare actual load for the month of March with a temperature-based neural network load forecast model (run after-the-fact with actual temperatures) suggest only a slight difference, likely owing to the reduction of commercial load and an uptick in residential load. The month of March in the region’s 13-state footprint was characterized by mild weather—and was up to 50% warmer than usual, it noted.
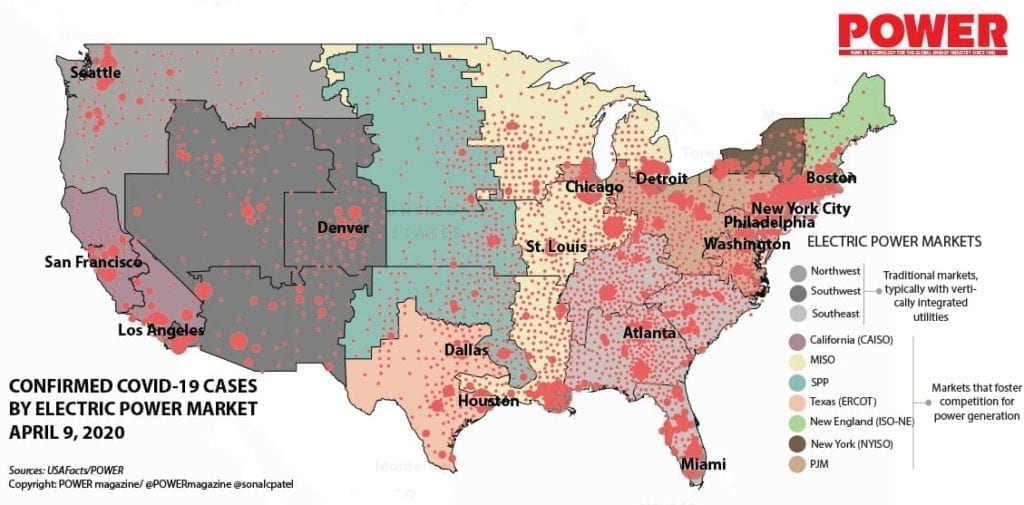
According to Johns Hopkins, which is compiling a data set of publicly reported cases, more than 400,000 COVID-19 cases have been confirmed in the U.S., a figure experts suggest may be understated owing to a dearth of testing access. Most are in the state of New York, which, as of April 8 (at 2:13 p.m. EDT), had confirmed 140,386 cases. But hotspots are also emerging in other states within PJM’s footprint—specifically (in order of confirmed cases) in New Jersey (44,416); Michigan (18,970); Pennsylvania (14,956); Illinois (13,553); Indiana (5,510); Ohio (4,782); Maryland (4,371); Tennessee (4,139); North Carolina (3,347); Virginia (3,335); the District of Columbia (1,211); Kentucky (1,149); and West Virginia (412).
PJM is now working to develop longer-term forecast impacts (for the period ranging from 2021 to 2035), which will consider three economic forecasts based on three scenarios: pandemic; severe pandemic; and critical pandemic. “The scenarios differ by number of infections, mortality rates, hospitalization rates, duration of infection increases, etc,” said Tom Falin and Chris Pilong, members of PJM’s Markets & Reliability Committee, on March 26.
As POWER reported on April 7, the Energy Information Administration (EIA) noted in its latest Short-Term Energy Outlook it expects significant impacts to U.S. electricity consumption. The EIA lowered its estimates for power generation by 3% through the rest of this year, noting the COVID-19 pandemic “has caused significant changes in energy fuel supply and demand patterns,” resulting in a crash in crude oil prices, and “similar uncertainties persist across EIA’s outlook for other energy sources, including natural gas and electricity.”
The grid operator that is perhaps seeing the biggest impact from the pandemic is the New York Independent System Operator (NYISO). On April 6, NYISO observed that its load curves are being reshaped. “By the middle of March, energy use on the grid had declined by roughly 2 to 3%, with daily peak energy use (the highest amount of energy used at any point during the day) about 2% below peak for this time of year. During the week that ended March 27, we saw energy use decline even further, with a total reduction of 4 to 5%,” it said.
The reductions in energy use during the morning ramping period are more pronounced in New York City and on Long Island, it noted. “Demand reductions of nearly 11% have been observed in those areas of the state during the morning ramping period. NYC load is also diminished throughout the day, primarily due to a reduction in commercial energy usage.”
NYISO noted the departure from historical behavioral patterns caused by New York’s stringent response to COVID-19, including lockdowns, is “historically unprecedented.” The grid entity also said it is now working to further refine forecasts “based on the societal changes” it is seeing. “These forecasts will help our grid operators prepare for these evolving load profiles.”
—Sonal Patel is a POWER senior associate editor (@sonalcpatel, @POWERmagazine).